EDUCATION DASHBOARD

Unifying school operations for administrators, teachers, parents, and students in one platform

Research

Product Design

Prototyping

User Testing

Figma

Miro

An all-in-one dashboard consolidating school management, communication, and data tracking.

Streamlined attendance workflows through numerous iterations, achieving intuitive design where users completed unfamiliar tasks independently during testing.

8 Weeks

Education dashboard project overview showing consolidated school management interface

PROBLEM

Schools cobble together multiple disconnected systems (i.e. PowerSchool for administration, G Suite for teachers, Google Classroom for students, Seesaw for parents) creating fragmented workflows and user frustration.

Administrative staff struggle with scattered data. Teachers need quick task completion while managing classrooms. Parents want simple communication. Students need accessible information.

No single platform serves all four groups, forcing schools to pay for multiple products and users to learn multiple systems. This wastes time, increases cognitive load, and creates inefficiency - critical when attendance has strict deadlines.

Screenshots of multiple dashboards (i.e. PowerSchool for administration, G Suite for teachers, Google Classroom for students, Seesaw for parents)

iSams | Google Classroom | Seesaw
Screenshots used for educational competitive analysis

Behaviors & Needs:

  • Completes attendance daily by 9:00 AM while managing active classroom
  • Reports incidents and communicates with parents throughout the day
  • Tracks student assessment data, behavior patterns, and attendance

Ms. Jeanri

Grade 3 Teacher

Age 32

"I need to track attendance, behavior, and communicate with parents, all while teaching 25 students."

Behaviors & Needs:

  • Updates student data and handles parent inquiries at front desk
  • Monitors attendance completion across all classrooms
  • Coordinates communication between administration office, teachers, and families

Ms. Luyen

Admin. Assistant

Age 45

"I manage student records and bridge communication between parents and administration."

Behaviors & Needs:

  • Tracks progress for two children (3rd and 5th grade) in different programs
  • Needs quick access to schedules, grades, and school announcements
  • Signs up for activities and stays informed on important notices

Mr. Dave

Parent of Two Students

Age 38

"I want just one place to see my kids' schedules, grades, and school updates."

Constraints

Environment

  • Teachers complete attendance by morning deadlines while multi-tasking
  • Four user groups have varying tech proficiency
  • Interface must remain simple for independent parent/student use
  • Design accommodates frequent classroom interruptions
  • Administrative staff operate under strict daily time requirements

Goals

  • User: Teachers track attendance quickly; administrators access consolidated data; parents monitor multiple children; students view information independently.
  • Business: Reduce costs by eliminating multiple software subscriptions.
  • Design: Consolidate school management, communication, and data tracking into unified platform.

PROCESS

1 | RESEARCH

Leveraged 6+ years inside school operations: not just observing pain points, but having lived them across multiple systems I personally built and managed.
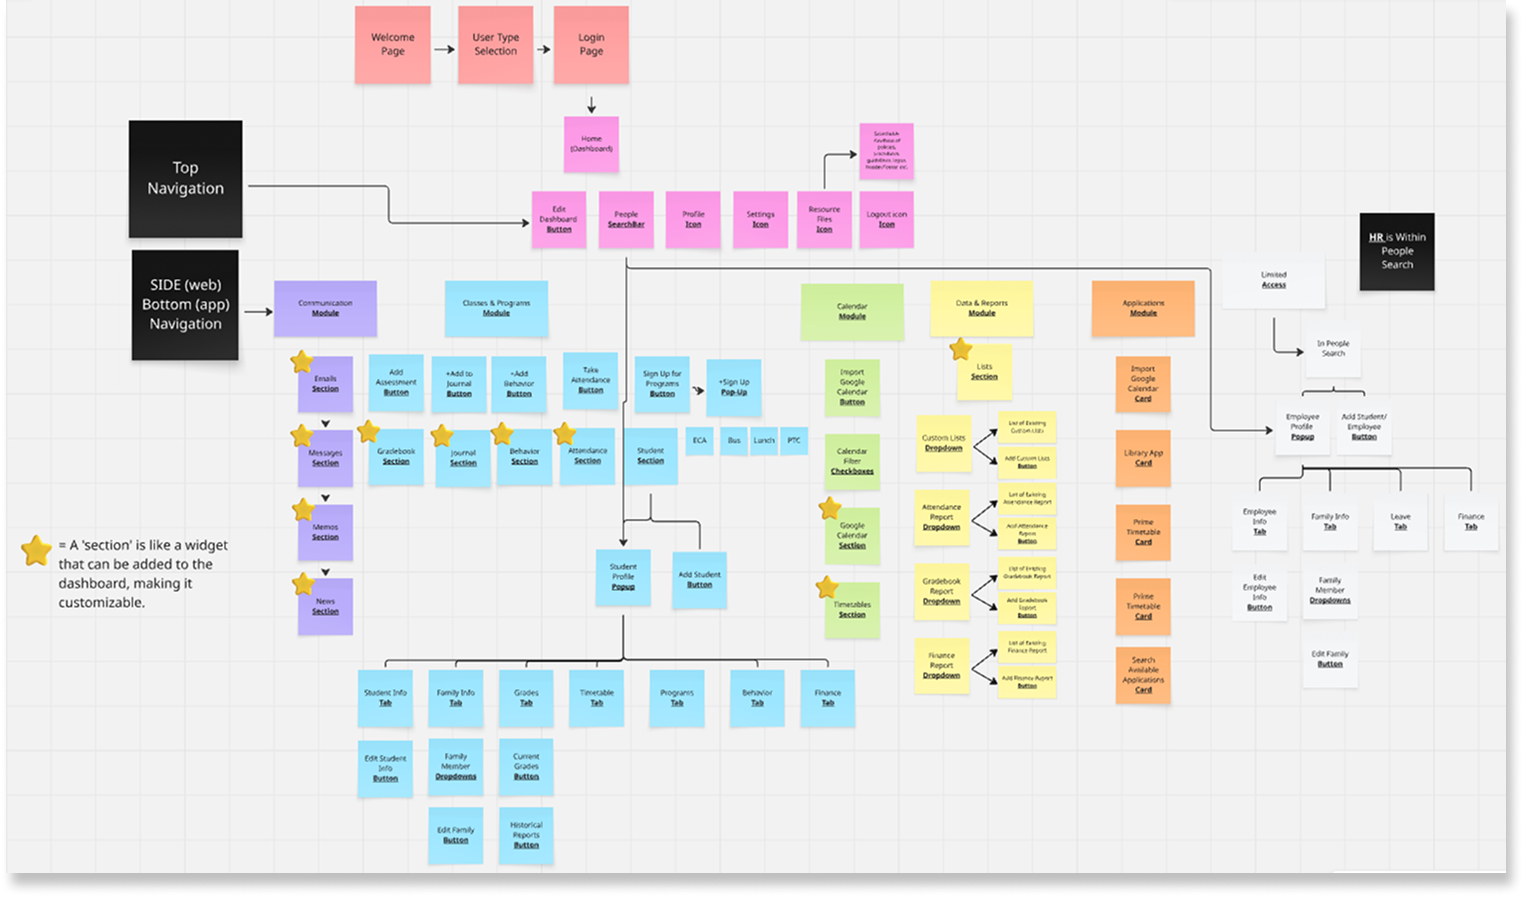
2 | DEFINE

Card sorting, affinity mapping, and journey mapping across four distinct user groups - surfacing where fragmented workflows created the most friction and deadline pressure.
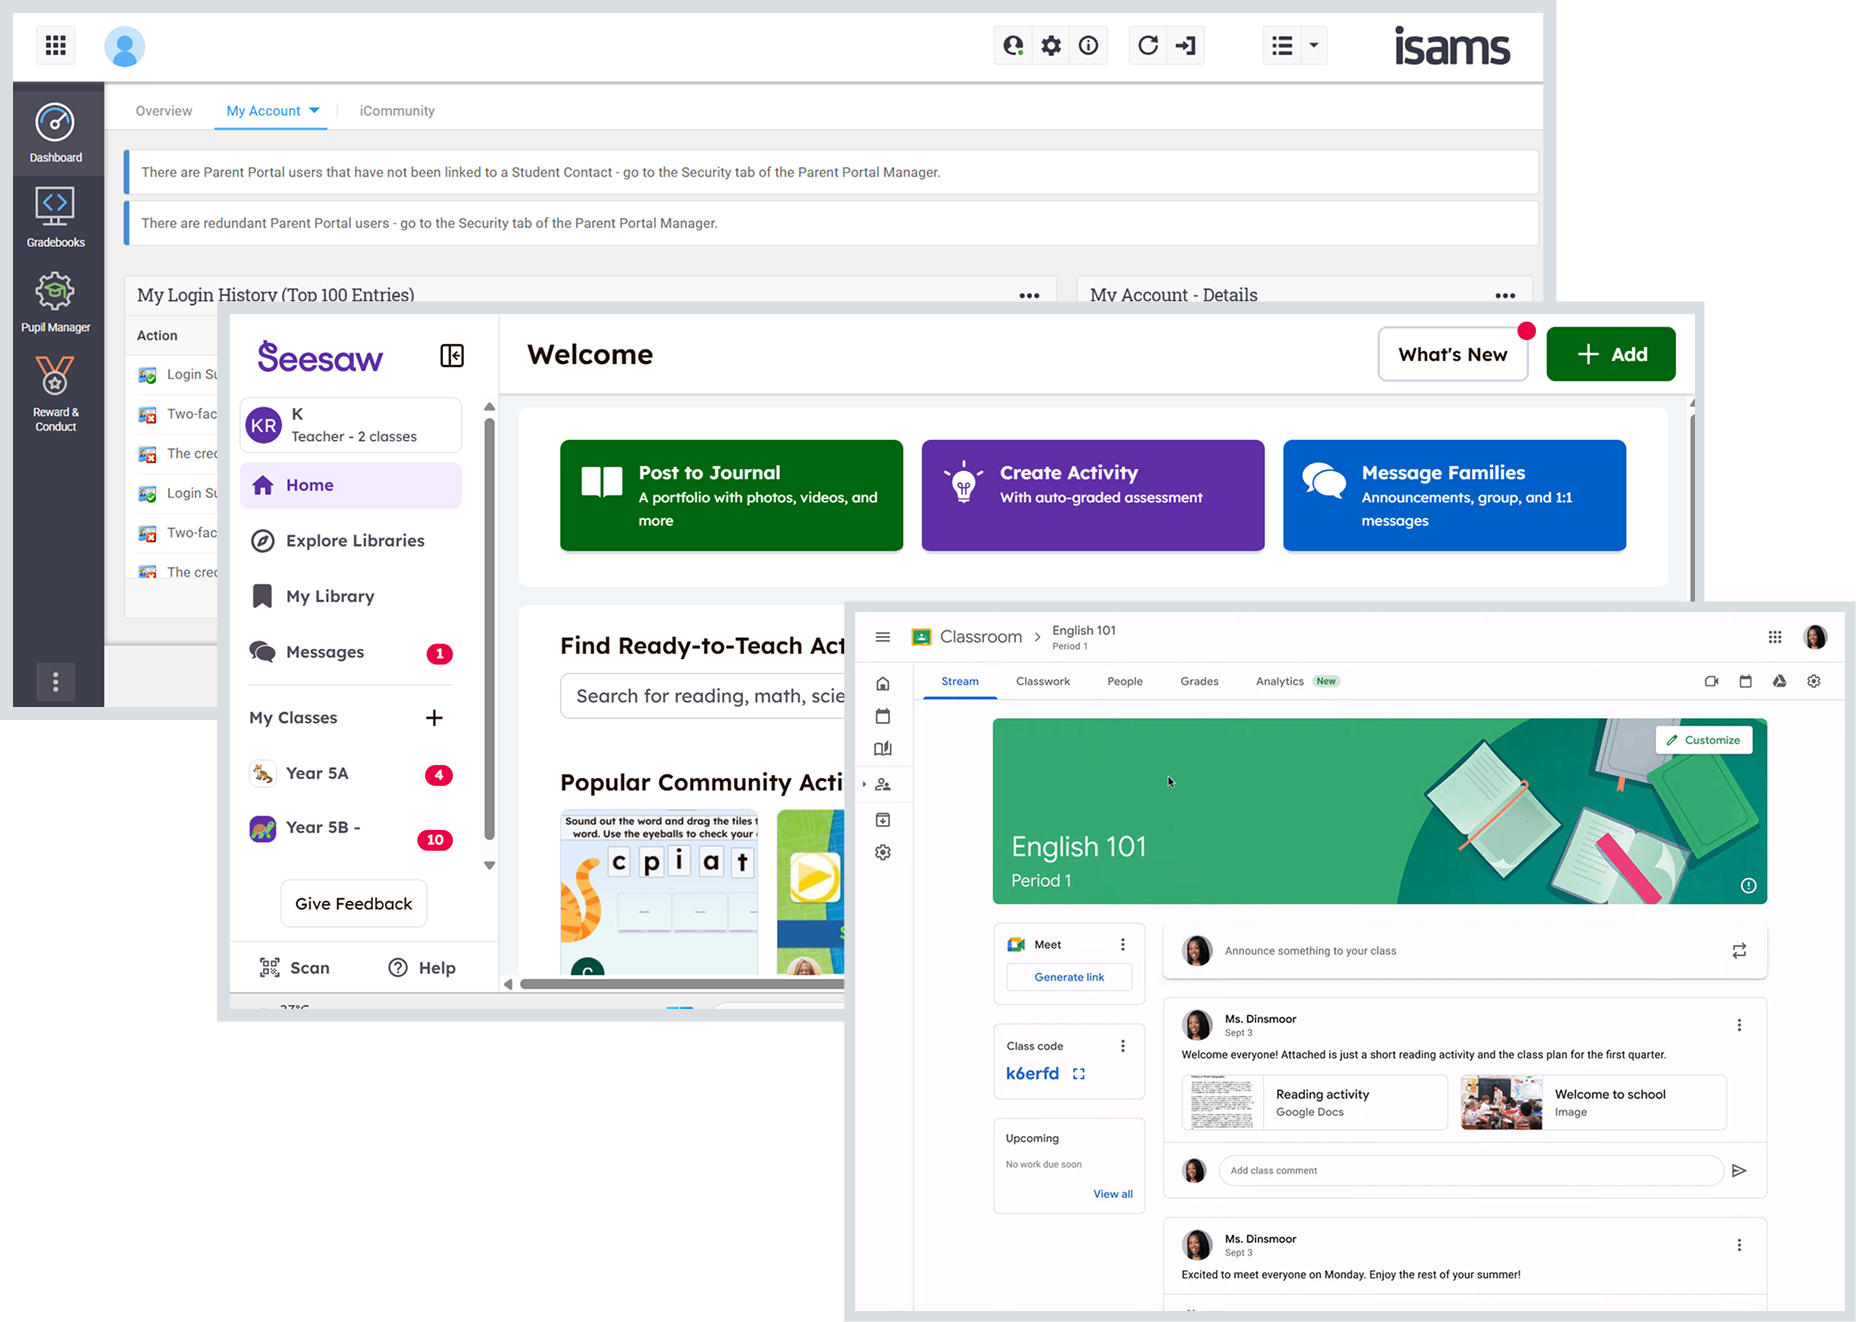
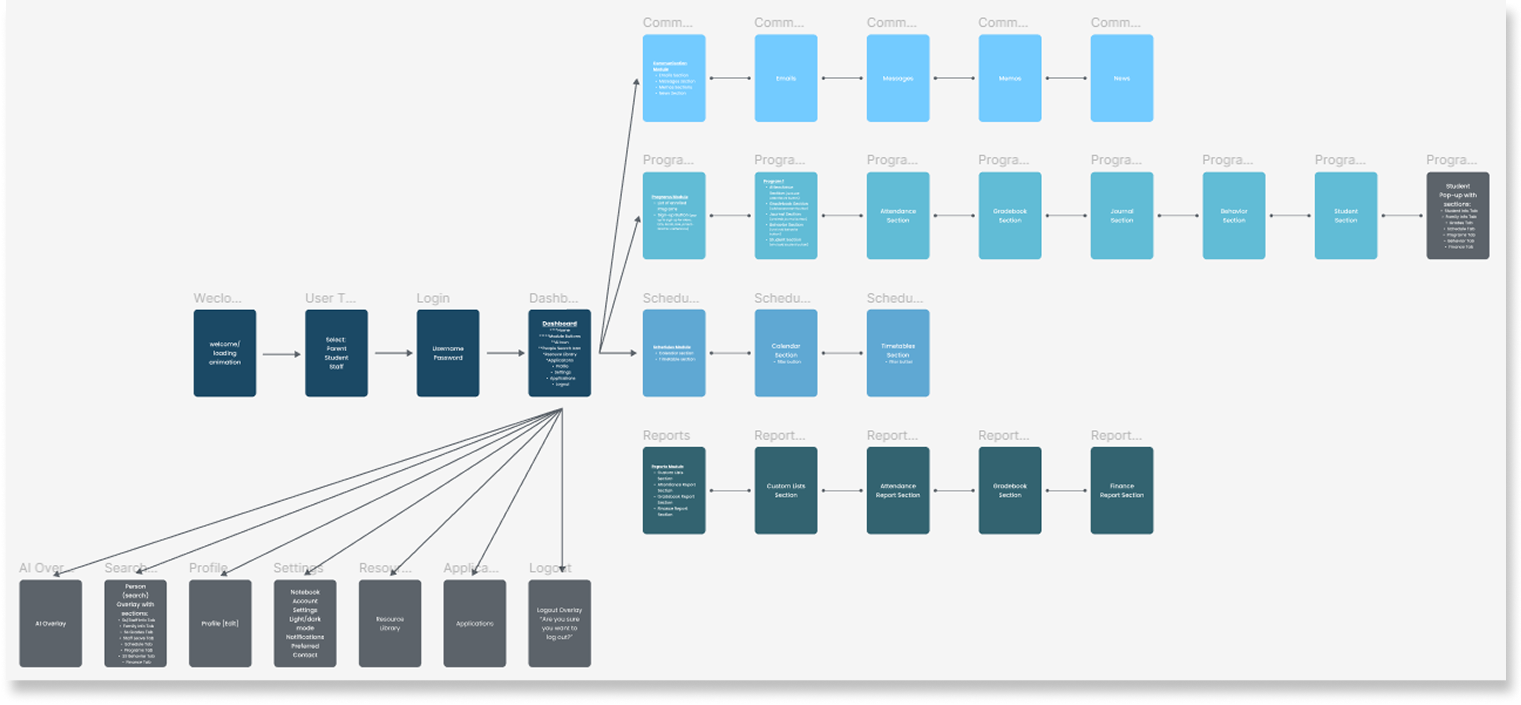
3 | IDEATE

Competitive analysis, hand sketching, and information hierarchy testing, deliberately exploring how one interface could serve radically different user needs without overwhelming any of them.
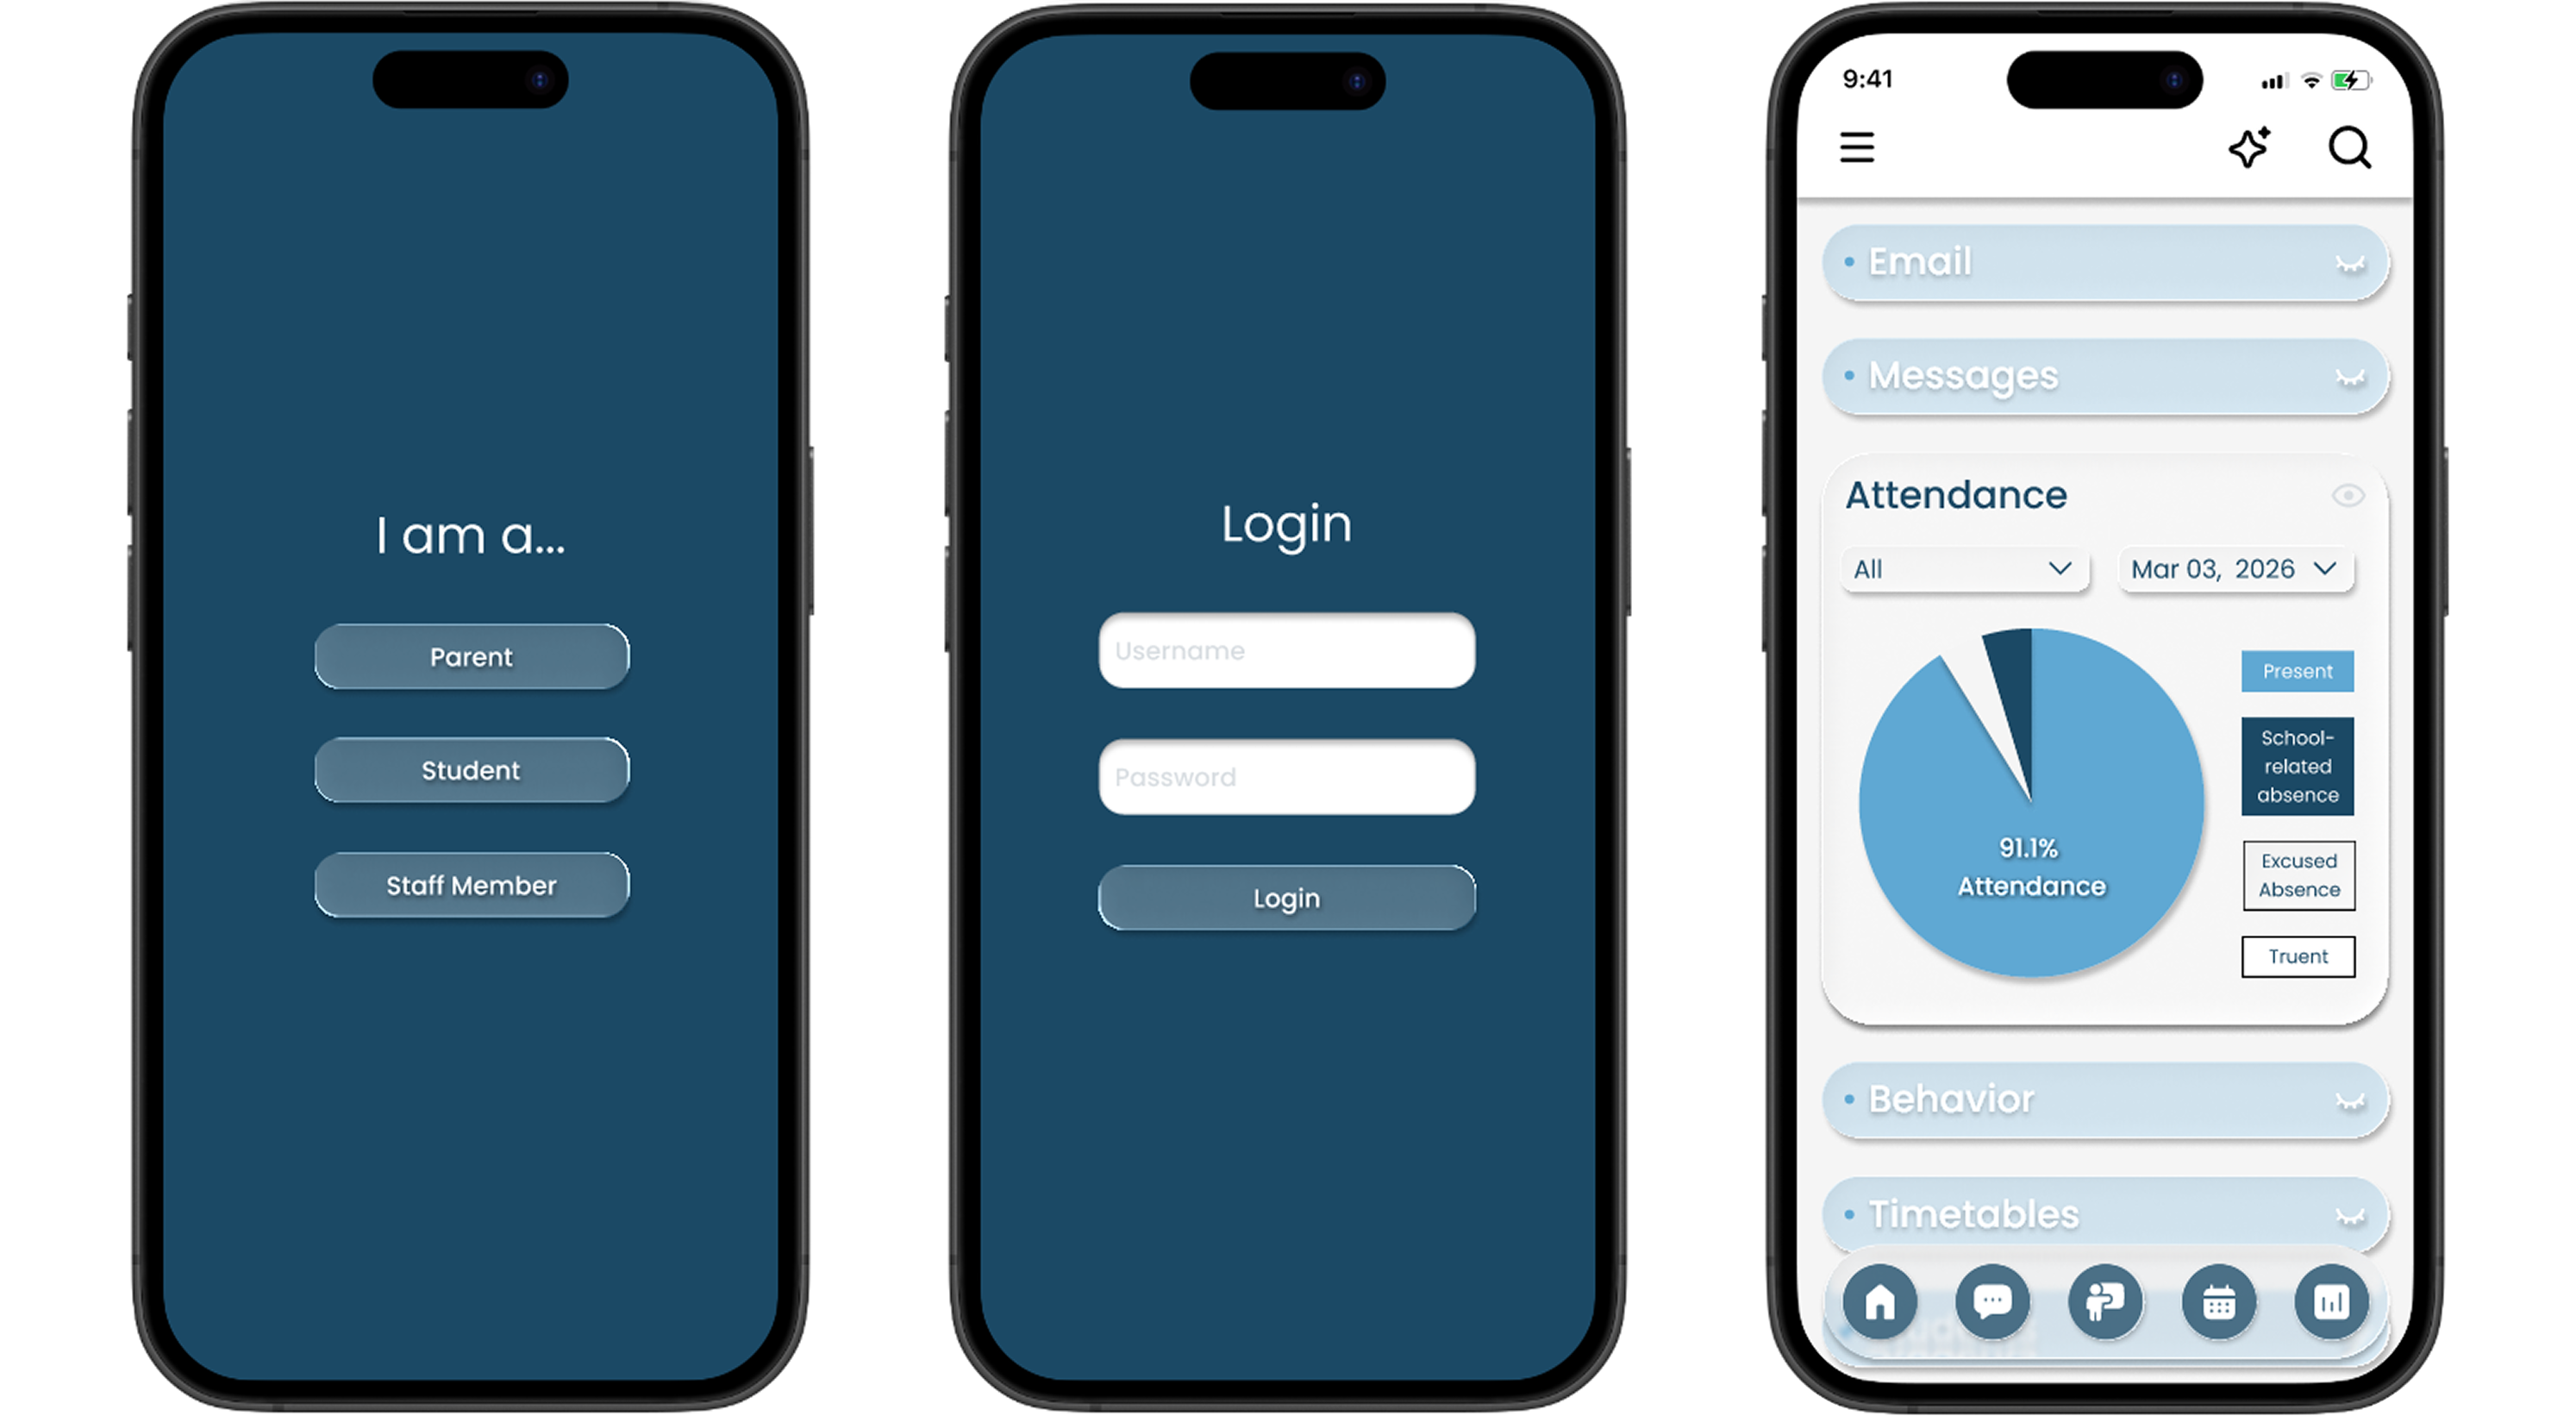
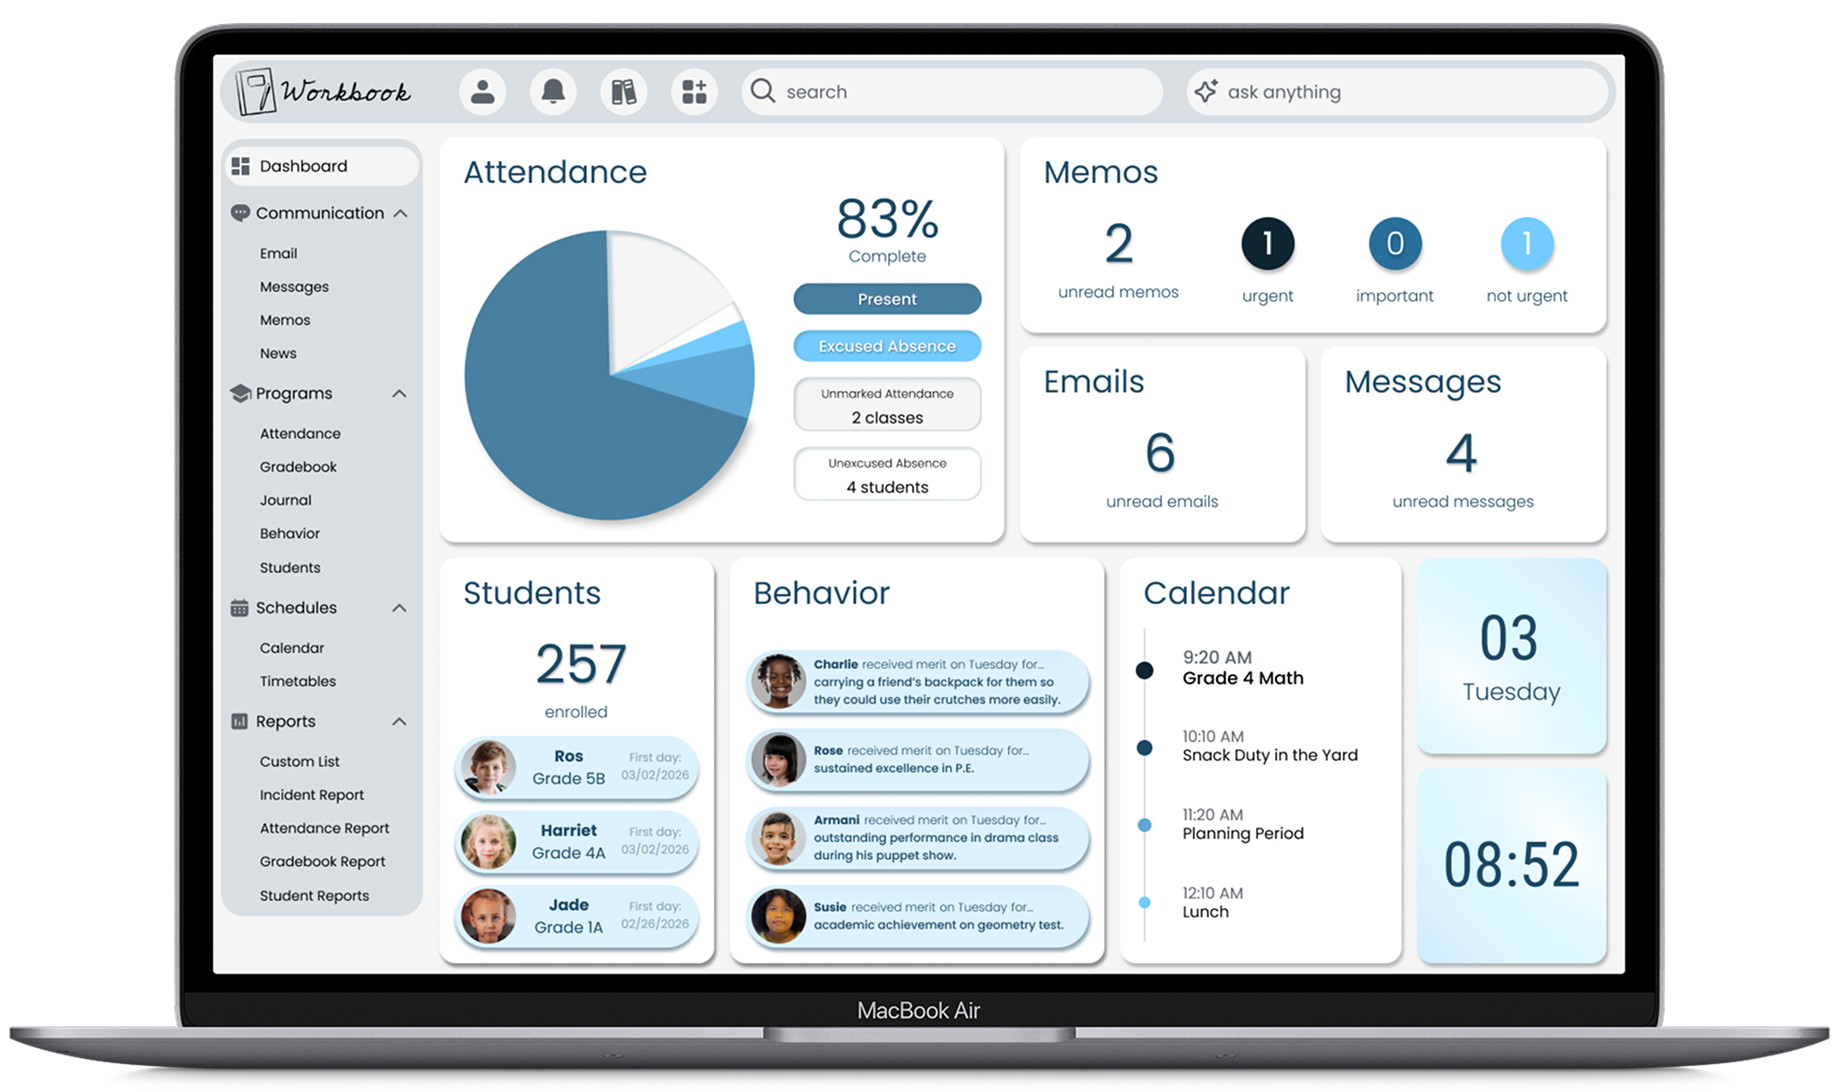
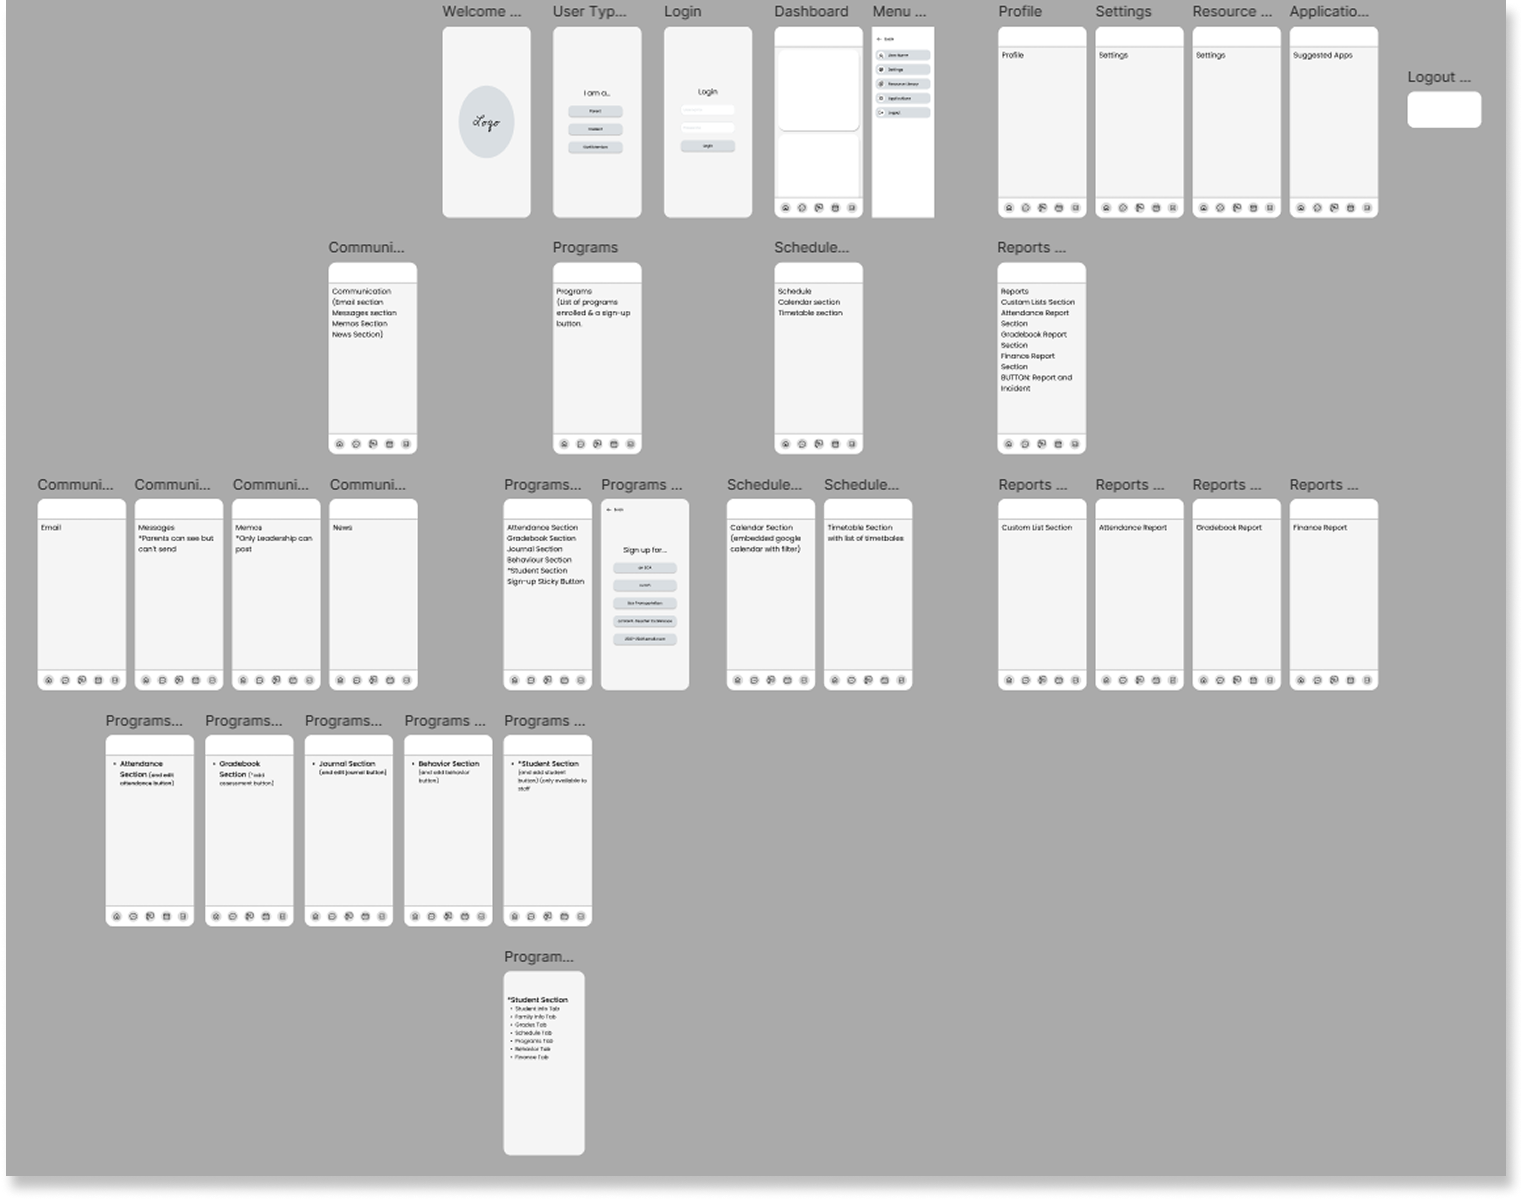
4 | PROTOTYPE

High-fidelity interactive prototypes for mobile and desktop, including complex state changes and UI interactions for the attendance workflows where speed and clarity were non-negotiable.

5 | TEST

Moderated and unmoderated testing with real former education colleagues, validating whether users could complete critical tasks independently, without guidance.

6 | ITERATE

12+ iterations driven by testing feedback: refined until only one additional change was requested after final validation. That's the number that matters.

Diagram of card sorting to prioritize dashboard features into affinity map to organize user needs

Conducted card sorting to prioritize dashboard features, created affinity maps to organize user needs

Wireframe of education dashboard layout showing initial UI structure and task flows

Tested different information hierarchies and card arrangements for multi-role access

Lo-fidelity wireframe of education dashboard layout showing initial UI structure and work flow

Designed a mobile model for cross-device translation

Key Decisions

1 | Attendance Status as Primary Dashboard Signal

DECISION

Refined design simplicity through 12+ iterations to increase speed of completion of attendance task flow.

RATIONAL

Morning attendance is legally critical for student safety - large visual reminds teachers to complete it and shows administrators unaccounted students for rapid parent contact.

TRADEOFF

Chart feels dated visually, but functional urgency and institutional familiarity outweighed modern aesthetic alternatives that might reduce visibility.

2 | Student Awareness Widgets on Dashboard

DECISION

Hid message content, showing only unread counts and urgency.

RATIONAL

Protects sensitive student information when children are near teacher computers - teachers see what needs attention without exposing confidential communications to students.

TRADEOFF

Requires additional clicks to access messages, but privacy protection for vulnerable students justifies the extra step in open classroom environments.

3 | Added Information Widgets to Increase Wellbeing

DECISION

Added recent enrollments and postive behavior tracking to dashboard.

RATIONAL

Staff awareness of new students improves welcoming and pastoral care. Visible positive behaviors enable cross-class acknowledgment, building student confidence and reinforcing progressive education culture.

TRADEOFF

Added visual density to dashboard, but pastoral benefits (pastoral care/student wellbeing, inclusive culture, staff coordination) outweighed minimalist design preferences.

Design solutions

Education dashboard project overview showing consolidated school management interface

Top navigation, side navigation, attendance pie chart, message counts, recent enrollments, behavior highlights, calendar, date/time widgets
Unified view across all user roles

Education dashboard attendance workflow interface with filterable roster and attendance status summary

Attendance summary card, filterable roster (by class, date, status), activity log confirming actions
Streamlined attendance to a three-step completion

Mobile view of education dashboard interface optimized for classroom attendance and communication

Responsive mobile version with touch-optimized controls

Full functionality on any device.

Outcomes

Expected Impact:

Consolidated 3–5 disconnected school platforms into a single unified system, eliminating redundant subscriptions and reducing cross-platform friction.

User Feedback:

100% task completion rate: every test participant completed unfamiliar workflows independently, without guidance.

Heuristic Improvement:

Streamlined attendance from a multi-step fragmented process to a 3-step flow, reducing time-to-complete for teachers working under morning deadlines.

Learning

What Worked

Deep iteration in ideation phase

What Changed

Scoped design to singlarly important task flow

What I'd Improve

Add attendance confirmation overlay

What Surprised Me

Simpler design outperformed fancy interactions

Looking for a Product Designer who brings strategic, critical thinking and user empathy?

Let's talk.

Resume  |  Contact